Downtown retailers “were very responsive” to a shoppers’ survey conducted in November by the Special Business District, Director Carrie Gartner said.
Nearly 300 shoppers participated in the survey, and the majority said the three major disadvantages of shopping downtown were the limited hours, lack of parking spaces and high prices.
Many retailers began staying open until 8 p.m. on Fridays and opening on Sundays. Gartner said retailers lowered prices on some items and added a wider range of price points. Also, the new city parking garage under construction on Walnut Street is expected to relieve some of the downtown parking problems, Gartner said.
Here is a summary of the survey results, which includes the highest percentages of affirmative responses:
Where do you do most of your non-grocery shopping?
Other Locations in Columbia…………………. 60 percent
Internet/Mail Order………………………………. 15 percent
Downtown Columbia……………………………. 14 percent
Outside Columbia………………………………….. 7 percent
What are the primary reasons for shopping where you do?
Convenience………………………………………… 62 percent
Price…………………………………………………… 51 percent
Selection……………………………………………… 50 percent
Familiarity…………………………………………… 33 percent
What types of speciality merchandise do we need more of in the District?
Cooking & Kitchen………………………………. 57 percent
Books…………………………………………………. 43 percent
Art & Craft Supplies…………………………….. 32 percent
Toys & Hobbies…………………………………… 31 percent
What types of household furnishings do we need more of in the District?
Kitchen & Tabletop………………………………. 54 percent
Accessories & Decor……………………………. 54 percent
Linens & Towels………………………………….. 53 percent
Furniture…………………………………………….. 33 percent
What types of apparel stores do we need more of in the District?
Women’s Casual………………………………….. 53 percent
Shoes…………………………………………………. 38 percent
Women’s Business………………………………. 32 percent
Men’s Casual………………………………………. 31 percent
What types of convenience merchandise do we need more of in the District?
Farmer’s Markets…………………………………. 65 percent
Groceries…………………………………………….. 57 percent
Bakery………………………………………………… 48 percent
Pharmacy……………………………………………. 29 percent
What kind of leisure/entertainment services do we need more of in the District?
Movie Theater……………………………………… 50 percent
Concerts/Live Music…………………………….. 43 percent
Live Theater………………………………………… 38 percent
Restaurants………………………………………….. 33 percent
What are the major advantages to shopping or doing errands in the District?
Support Local Business………………………… 79 percent
Appealing Atmosphere…………………………. 65 percent
Convenient Location…………………………….. 40 percent
Friendly Service…………………………………… 37 percent
What are the major disadvantages to shopping or doing errands in the District?
Lack of Parking……………………………………. 65 percent
Limited Hours……………………………………… 60 percent
High Prices…………………………………………. 58 percent
Traffic………………………………………………… 38 percent
What can district merchants do to improve their stores and restaurants?
Extend Business Hours…………………………. 56 percent
Lower Prices/Sales……………………………….. 54 percent
Provide Parking Validation……………………. 51 percent
Promotions/Advertising………………………… 41 percent
What are the best times for you to shop?
Weekdays after 6 p.m……………………………. 71 percent
Saturday Afternoon………………………………. 61 percent
Sunday Afternoon………………………………… 59 percent
Saturday Morning 31 percent
Finally, an upturn in retail
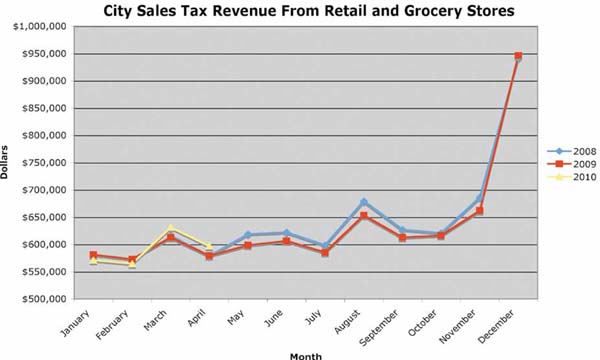
The city breaks sales tax revenue into eight categories, and the retail and grocery stores category is by far the largest and provides about half of the total receipts.
The recession caused a significant dip in retail sales and therefore in retail sales tax revenue. The revenue for the retail/grocery category in the fiscal year ending Sept. 30, 2009, was nearly 3 percent less than the previous fiscal year. But the latest data provided by the city shows an upswing after a two-year decline.
Notice the yellow line charting the monthly revenue in 2010. In March and April, monthly revenue finally rose above the revenue for the same months in 2008 and 2009. The revenue in March, $631,489, was 3 percent greater than in March 2009, and the revenue in April, about $597,000, was also 3 percent greater than the same month the previous year. For the second quarter ending March 31, revenue was up 1.6 percent.
COMO Staff
Downtown retailers respond to survey

COMO Staff
COMO Staff
Trash To Cash
COMO Staff
Uncommon carriers
COMO Staff
Race for space, fuels building boom
COMO Staff
The Mother Farm
Sunitha Bosecker
Growing Older And Better
Sean Spence
‘May It Please the Court’
Jodie Jackson Jr.
Hoss’s Grilled Southwest Corn Salad
Jim "Hoss" Koetting
Anticipating Change to Create the Future We Want
Barbara Buffaloe
One Degree
Bradley Williams
The Sound of Stillness
Kelsey Winkeljohn
The Last Word
COMO Staff